Posts

Showing posts from March, 2020

Animated Circle & ScreenSaver 25-03-2020

Image
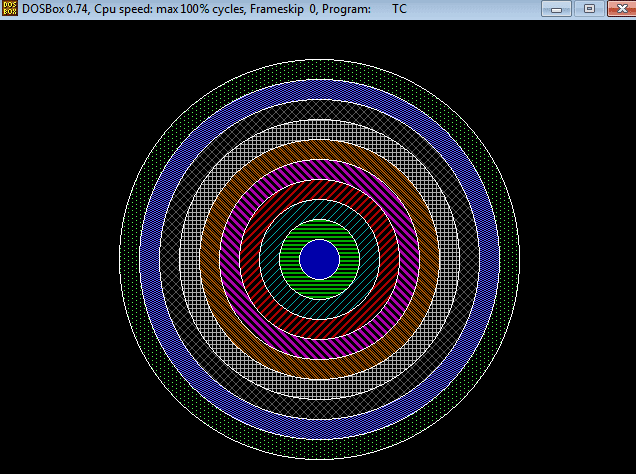
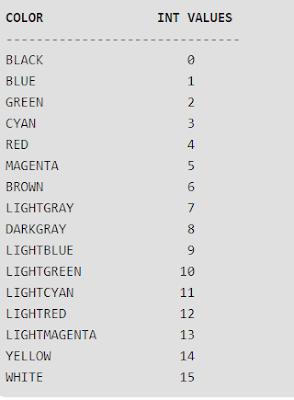
Write a Program to draw animation using increasing circles filled with different colors and patterns. #include<graphics.h>    #include<conio.h>   #include<dos.h>   void  main()   {     intgd=DETECT, gm, i, x, y;     initgraph(&gd, &gm,  "..\\BGI" );       x=getmaxx()/3;     y=getmaxx()/3;     setbkcolor(WHITE);     setcolor(BLUE);      for (i=1;i<=8;i++)             {         setfillstyle(i,i);         delay(20);         circle(x, y, i*20);         floodfill(x-2+i*20,y,BLUE);     }     getch();     closegraph(); }  Program to make screen saver in that display different size circles filled with different colors and at random places. #include<stdio.h>    #include<conio.h>    #include<graphics.h> #include<dos.h>   #include<stdlib.h>    void  main()   {     intgd=DETECT,gm,i=0,x,xx,y,yy,r;      //Initializes the graphics system        initgraph(&gd,&gm, "..\\bgi" );       x=getma

Thoeory of Automata

Theory of Automata  Study Material  By Rabia Shahid Finite Automata & Difference in DFA and NDFA DFA and NDFA Slides Language to Finite Automaton Creation Acceptability of string by NFA Example 1 Acceptability of string by DFA (Example no 1) ( Example no 2 ) ( Example no 3 )  ( Example no 4 ) ( Example no 5 ) NFA to DFA Conversion (Example 1) (Example 2) NFA to DFA Conversion (Slides) NFA to DFA Conversion using Epsilon Closure Books Introduction-to-computer-theory-by-daniel-cohen An-Introduction-to-Formal-Languages-Automata-3rd-Edition-by-Peter-Lin Regular Languages and Finite Automata by Tripos Marcelo Fiore- Cambridge University Online Material Theory of Automata (Virtual University)   (Video Lectures) Theory of Automata (Tutorial Point)   (Video Lectures) Theory of Automata (Java T Point)   (Video Lectures) Online Blog Online Notes Theory of Automata notes Univerisity of San Francisco Online notes I

Calculation and Program for Bresenhams Line 24-03-2020

Image
Step1:  Start Algorithm Step2:  Declare variable x 1 ,x 2 ,y 1 ,y 2 ,d,i 1 ,i 2 ,dx,dy Step3:  Enter value of x 1 ,y 1 ,x 2 ,y 2                 Where x 1 ,y 1 are coordinates of starting point                 And x 2 ,y 2  are coordinates of Ending point Step4:  Calculate dx = x 2 -x 1                 Calculate dy = y 2 -y 1                 Calculate i 1 =2*dy                 Calculate i 2 =2*(dy-dx)                 Calculate d=i 1 -dx Step5:  Consider (x, y) as starting point and x end as maximum possible value of x.                 If dx < 0                         Then x = x 2                         y = y 2                         x end =x 1                 If dx > 0                        Then x = x 1                         y = y 1                         x end =x 2 Step6:  Generate point at (x,y)coordinates. Step7:  Check if whole line is generated.                 If x > = x end                 Stop. Step8:  Calculate co-ordinates of the

Bresenhams Line Generation Algorithm 23-03-2020

Image
Instruction: First of all carefully watch video lecture then read theory. Video Lecture:  Bresenhams Line Algorithm   This algorithm is used for scan converting a line. It was developed by Bresenham. It is an efficient method because it involves only integer addition, subtractions, and multiplication operations. These operations can be performed very rapidly so lines can be generated quickly. In this method, next pixel selected is that one who has the least distance from true line. The method works as follows: Assume a pixel P 1 '(x 1 ',y 1 '),then select subsequent pixels as we work our may to the night, one pixel position at a time in the horizontal direction toward P 2 '(x 2 ',y 2 '). Once a pixel in choose at any step The next pixel is Either the one to its right (lower-bound for the line) One top its right and up (upper-bound for the line) The line is best approximated by those pixels that fall the least distance from the path bet

How to change Background Color and Display Counter on Screen (At Specific Position) 18-03-2020

Image
Rabia Shahid · Post How to change Background Color and Display Counter on Screen (At Specific Position) 18-03-2020 Posting as GCW CS The header file graphics.h contains  getbkcolor()  function which returns the current background color. Syntax : int getbkcolor(); As getbkcolor() returns an integer value corresponding to the background color, so below is the table for Color values. Colors Table : First of all read all requirements and enlist all functions and header files which is necessary to perform all functions. #include< conio.h >  //  Used for getch #include< stdlib.h > //  Use for  exit (0) #include< stdio.h >  // Use for sprintf #include< graphics.h >  //  Use for loading graphic driver #include< dos.h >   // Use for delay void main() { int gd=DETECT,gm; char ch[5];      // we use character array because we want to display counter //at specific position on s

Color CRT Monitors 17-03-2020

Image
Rabia Shahid · Post Color CRT Monitors 17-03-2020 Posting as GCW CS A CRT monitor displays color pictures by using a combination of phosphors that emit different colored light. With the combination of phosphor a range of colors can be displayed. There are two techniques used in color CRT monitors: Beam Penetration Method Shadow Mask Method Beam Penetration Beam Penetration In beam penetration method two layers of phosphor, usually coated onto the inside of  the CRT screen, and the displayed color depend on how far the electron beam penetrates into the phosphor layers. At intermediate beam speeds, combinations of red and green light are emitted to show two additional colors, orange and yellow. Beam penetration is an inexpensive way to produce colors as only a few colors are possible and the quality of picture is also not impressive. Shadow Mask Shadow Mask Shadow mask methods can display a wide range of colors

How to create bar chart in computer graphics (16-03-2020)

Image
Creating a bar chart in C with  graphics.h  library is very decent to show the result in a graphical form. To have a graph in your program first thing to do is to initialize a graph. Second thing is, initialize  X axis  and  Y axis  of the graph. This can be done by calling the line function twice with the co-ordinate of the endpoints of both the axis. The third step is to  create bars . Now  to create bars , you can easily choose a styling for the bar by calling the function  setfillstyle(LINE_FILL, RED)  before making the bar. Fourth and the last step is to  make the bar with four parameters  which should be numbered. These numbers will be the co-ordinates of the bars. These functions need the  graphic.h  file to be included in the program before using any of these functions. graphics.h - line(), bar() and setfillstyle() functions  #include <graphics.h> #include < conio.h > int  main() {     int   gd  = DETECT, gm; // detect graphic mode and in